

Image Details
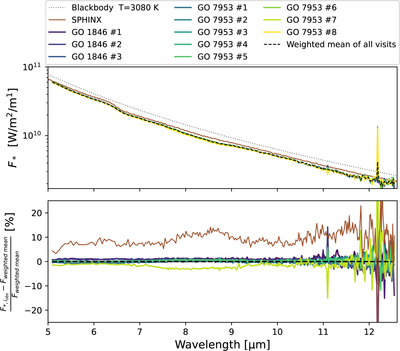
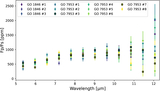
Caption: Figure B1.
Top: the spectra of a blackbody (3080 K), the SPHINX model, each individual visit, and the weighted mean of all observations. Bottom: the percent difference of each spectra relative to the weighted mean of all visits.
(The data used to create this figure are available in the online article.)
(The data used to create this figure are available.)
Other Images in This Article
Copyright and Terms & Conditions
© 2026. The Author(s). Published by the American Astronomical Society.

Copyright ©
2026 Astronomy Image Explorer. All Rights Reserved.
