

Image Details
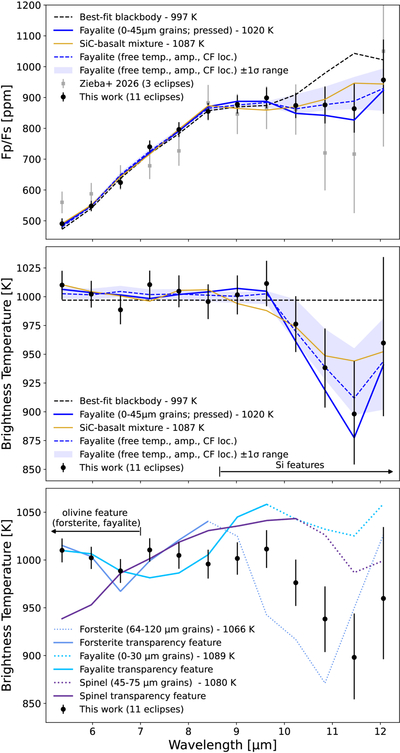
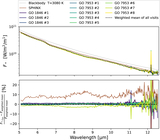
Caption: Figure 2.
Top: planet-to-star flux ratio emission spectrum from the three eclipses published in S. Zieba et al. (2026), compared to the combined spectrum from all 11 eclipses in this work (including the three previously published). Middle and bottom: the same spectrum converted to brightness temperature to highlight the feature near 10–12 μm. The top two panels show the best-fit blackbody, fayalite, and SiC–basalt mixture models (each with temperature as a free parameter), and the three-parameter Fayalite model with temperature (“temp.”), amplitude (“amp.”), and CF location (“CF loc.”) as free parameters. The bottom panel shows the best-fit forsterite, fayalite, and spinel models of small, loosely packed grains with their corresponding transparency features denoted by the solid lines.
(The data used to create this figure are available in the online article.)
(The data used to create this figure are available.)
Other Images in This Article
Copyright and Terms & Conditions
© 2026. The Author(s). Published by the American Astronomical Society.

