

Image Details
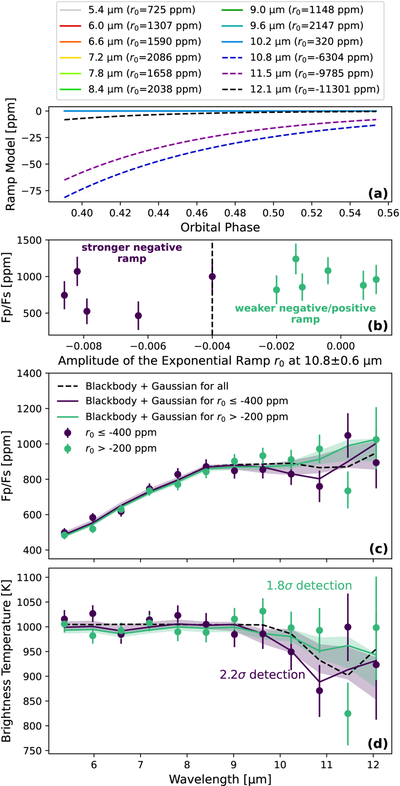
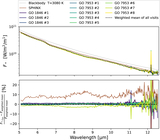
Caption: Figure 3.
(a) The ramp models for all spectral channels for GO 7953 #5 (2025 October 1) showing the change in ramp shape for channels in the shadowed region. (b) The planet-to-star flux ratios of each observation as a function of the ramp amplitude r0 in the 10.8(6) µm bin. (c) The averaged planet-to-star flux spectra for the two groups. (d) The same spectra converted to brightness temperature. Panels (c) and (d) include the blackbody and Gaussian feature model (free temperature, amplitude, center, and width) fit to all 11 observations and each subgroup. The shaded regions correspond to the 1σ range of the best-fit models. The feature amplitude is detected to 2.2σ for the stronger ramp amplitude group and 1.8σ for the weaker ramp amplitude group.
Other Images in This Article
Copyright and Terms & Conditions
© 2026. The Author(s). Published by the American Astronomical Society.

