

Image Details
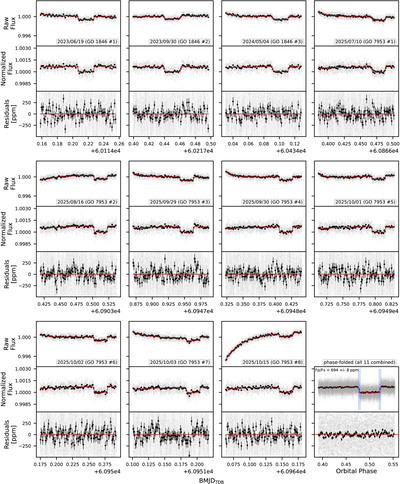
Caption: Figure 1.
The 11 three-panel plots show the raw flux, normalized flux, and residuals of the white light curves for each MIRI/LRS eclipse with their best-fit model overplotted in red. The two-panel figure in the bottom right is the phase-folded combined white light curve of all 11 visits with the blue vertical lines indicating T1–T4, i.e., ingress and egress. The gray points are the raw data at the native resolution of the observations while the black points are the binned data to a cadence of 1.6 minutes.
(The data used to create this figure are available in the online article.)
(The data used to create this figure are available.)
Other Images in This Article
Copyright and Terms & Conditions
© 2026. The Author(s). Published by the American Astronomical Society.

