

Image Details
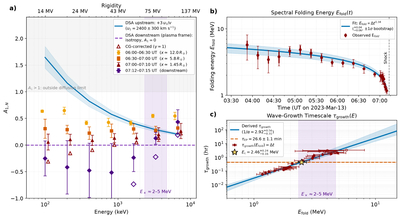
Caption: Figure 5.
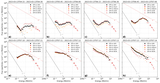
The pitch-angle anisotropy and the inversion to wave-growth time. Panel (a): the first-order anisotropy A1,N versus proton energy, with rigidity on the top axis. Colored filled markers show the observed A1,N from EPI-Lo in three upstream windows and one downstream (see legend). Open markers show the near-shock upstream and downstream anisotropies after the Compton–Getting correction to the plasma frame. The solid blue curve is the upstream DSA ceiling ﹩{A}_{1}^{{\rm{DSA}}}=3{u}_{1}/v﹩, and the dashed purple line at A1,N = 0 is the downstream steady-state DSA reference (isotropy in the plasma frame). The gray region (﹩{A}_{1}^{{\rm{DSA}}}\gt 1﹩) marks where the small-anisotropy diffusion approximation breaks down (see Appendix C). The purple-shaded band marks the confinement–escape transition Ex ≈ 2–5 MeV, bracketing the downstream A1,N sign reversal in the spacecraft frame. Panel (b): the temporal evolution of the observed spectral folding energy Efold (red circles). The inner error bars show the statistical uncertainty, and outer bars show the statistical and systematic uncertainties combined. The solid blue curve is the power-law fit Efold ∝ Δt α, and the shaded band is the 68% confidence interval from the bootstrap method described in the text. Panel (c): the inferred wave-growth timescale τgrowth versus folding energy. Red circles show the panel (b) data reexpressed as (Efold,i, Δti) pairs. The solid blue curve is the uniform-Γk inversion τgrowth(E) ∝ E1/α, and the shaded band is its 68% confidence interval. The dashed orange line marks the precursor convective timescale τEP, and the star marks the Ec where the two timescales meet.
Other Images in This Article
Copyright and Terms & Conditions
© 2026. The Author(s). Published by the American Astronomical Society.

