

Image Details
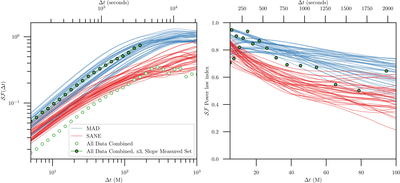
Caption: Figure 5.
Comparison of the structure functions of MAD and SANE GRMHD simulations from the Sgr A* simulation library of 72 movies. The open green circles show the measured observational structure function, while the filled green circles with black edges show the same values multiplied by three solely to compare shape; this constant factor does not affect the logarithmic slope. Left: structure functions evaluated at 300 lags between 5 and 1500M. Right: slope of the log-log structure function (equivalently, the power-law index of the structure function) evaluated on a sliding pair of points over the first 20 lags. Evidently, on lags of hundreds of seconds for Sgr A*, SANE models bend to a shallower slope, suggesting the spectrum of Sgr A* variability is a closer match to MAD dynamics.
Other Images in This Article
Copyright and Terms & Conditions
© 2026. The Author(s). Published by the American Astronomical Society.

