

Image Details
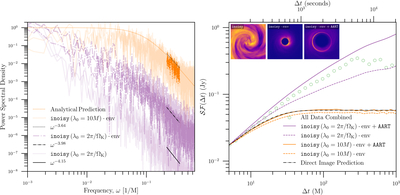
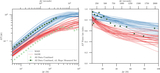
Caption: Figure 3.
Power spectral densities (PSDs) and structure functions for controlled inoisy+AART experiments. Left: PSDs for two inoisy prescriptions. Orange curves correspond to a constant time correlation λ0 = 10 M, while purple curves correspond to a Keplerian-like prescription λ0(r) = 2π/ΩK(r). In each case, solid lines correspond to the ray-traced light curves (inoisy+AART), dashed lines correspond to the emissivity model including the envelope only (inoisy), and dotted lines correspond to the underlying GRF (no envelope). The short black line segments indicate power-law fits to the PSD slope over the frequency ranges shown. Right: the corresponding structure functions of the cases shown in the left panel. Green open circles show the structure function computed from Sgr A* observations (see Section 2). The simulated structure functions are normalized to the observational one to emphasize differences in morphology. The inset shows snapshots of the GRF, the enveloped inoisy emissivity, and the resulting ray-traced image. The black dashed–dotted curve shows the analytic lensing contribution for the constant λ0 = 10 M case.
Other Images in This Article
Copyright and Terms & Conditions
© 2026. The Author(s). Published by the American Astronomical Society.

