

Image Details
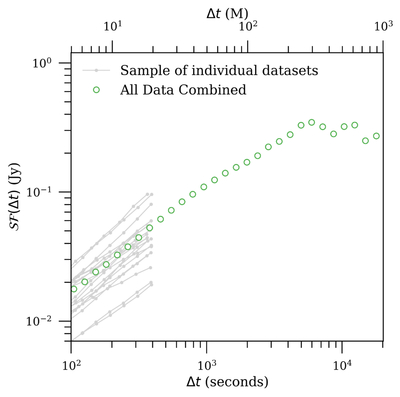
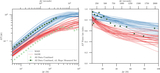
Caption: Figure 2.
Observational structure function of Sgr A* obtained from the combined ALMA, SMA, and CARMA data described in Section 2 (green circles). Gray lines show structure functions from several individual ALMA light curves, included to illustrate the scatter among observing epochs. ALMA data are used because they have the highest signal-to-noise ratio. The individual structure functions have mostly similar slopes but different normalizations. They are shown only for Δt ≤ 400 s, approximately one-tenth of the individual light-curve durations, where the statistics remain robust. Time lags are shown in both seconds and gravitational time units for the Galactic center SMBH.
Other Images in This Article
Copyright and Terms & Conditions
© 2026. The Author(s). Published by the American Astronomical Society.

