

Image Details
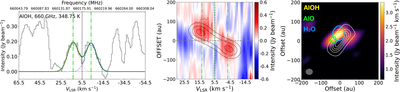
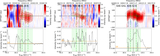
Caption: Figure C1.
Possible AlOH J = 21–20 transition (fine structure) at 660 GHz. The spectrum is fitted with the same procedure as TiO (see Figure 1), and the fitting parameters are reported in Table 1. The PV diagram is overlaid with a Keplerian rotation model at 30%, 60%, and 90% of the peak intensity (see Section 3.2). Red contours are plotted at intervals of 3σ, starting from 3σ. At 415 pc, 100 au = 0﹩\mathop{.}\limits^{{\unicode{x02033}}}﹩24. The spatial distribution is masked below 3σ and is overlaid with the emission peaks of AlO and H2O (≥95% of the peak intensity). The continuum in white contours starts at 10σ. The channel rms of the AlOH emission is 4.0 × 10⁻² Jy beam −1, and the continuum rms is 5.0 × 10⁻³ Jy beam −1.
Other Images in This Article
Copyright and Terms & Conditions
© 2026. The Author(s). Published by the American Astronomical Society.

