

Image Details
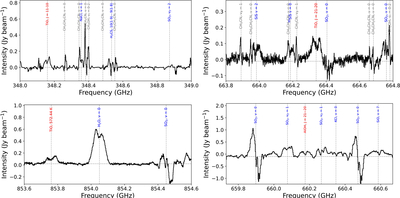
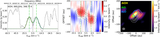
Caption: Figure A1.
The 1 GHz wide spectra of the detected TiO and possibly observed AlOH lines. The mean spectra are extracted from a circular area within 100 au from the continuum center. The TiO and AlOH transitions are marked in red, iCOM transitions in gray, and other molecular transitions in blue. The baselines are tuned with spectral fittings.
Other Images in This Article
Copyright and Terms & Conditions
© 2026. The Author(s). Published by the American Astronomical Society.

Copyright ©
2026 Astronomy Image Explorer. All Rights Reserved.
