

Image Details
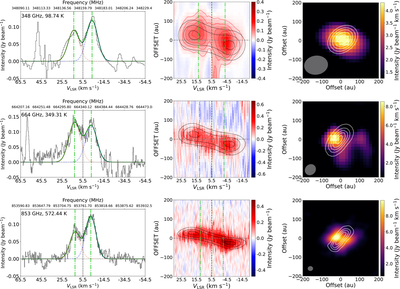
Caption: Figure 1.
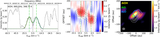
Left: mean spectra of detected TiO transitions within 100 au from the continuum center. These mean spectra include both velocity peaks seen in the PV diagrams. The Gaussian fits of the two velocity components and the overall profile are indicated with the blue and red dashed lines and dark green solid lines, respectively. The peak velocity offsets (Vpeak) are marked with light green dashed–dotted lines. Vpeak is the velocity of the measured symmetric peak offset, i.e., the two peaks are at ±Vpeak km s−1 from the system velocity (5.5 km s−1). The Gaussians are fit with the constraints that both components are with the same Vpeak. The line widths (ΔVFWHM) and peak offsets (Vpeak) are reported in Table 1. Middle: PV diagrams overlaid with a Keplerian rotation model at 30%, 60%, and 90% of the peak intensity (see Section 3.1). The red contours are plotted at intervals of 3σ, starting from 3σ, for the top and bottom panels. For the top panel, the contours are plotted at intervals of 15σ, starting from 15σ. The feature with the low-velocity gradient at ∼−200 au for TiO at 348 GHz is from the extended material. Right: spatial distribution. At 415 pc, 100 au = 0﹩\mathop{.}\limits^{{\unicode{x02033}}}﹩24. From top to bottom, the emission is masked below 100σ, 5σ, and 3σ, while the continuum is shown in white contours starting at 300σ, 10σ, and 10σ. The rms of the molecular emission are 2.0 × 10⁻³, 5.5 × 10⁻², and 4.0 × 10⁻² Jy beam −1, while those of the continuum are 1.0 × 10⁻³, 1.1 × 10⁻², and 5.0 × 10⁻³ Jy beam −1.
Other Images in This Article
Copyright and Terms & Conditions
© 2026. The Author(s). Published by the American Astronomical Society.

