

Image Details
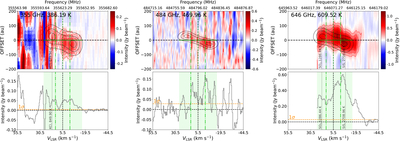
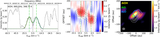
Caption: Figure B1.
PV diagrams and spectra for the three blended TiO transitions. The red contours are plotted at intervals of 4σ, starting from 4σ. The mean spectra are extracted from a circular area within 100 au from the continuum center. At 415 pc, 100 au = 0﹩\mathop{.}\limits^{{\unicode{x02033}}}﹩24. The effective emission range (Vpeak = 8.0 km s−1 and ΔVFWHM = 13 km s−1, Table 1) of TiO is shaded with light green. Noise levels at 1σ are marked with orange dashed lines. The spectrum at 646 GHz is truncated at the edge of the spectral window. The 484 GHz transition is blended with extended emission, characterized by low-velocity-gradient features at offsets of ≳±100 au. The 646 GHz transition is blended with compact emission from SiS and SO2, while the 355 GHz transition is contaminated by both extended and compact emission, including KCl. From left to right, the rms of the molecular emission are 5.5 × 10⁻⁵, 4.0 × 10⁻², and 4.0 × 10⁻² Jy beam −1.
Other Images in This Article
Copyright and Terms & Conditions
© 2026. The Author(s). Published by the American Astronomical Society.

