

Image Details
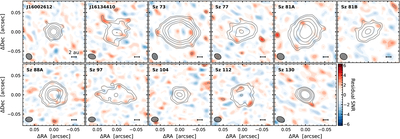
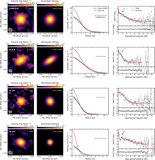
Caption: Figure A3.
Gallery of residuals plots generated by subtracting the frank model (sampled at the same uv-points as the observations) from the data and then imaged with CLEAN and robust 0.5. The color scale represents the values of residual SNR in units of the observed noise (σrms) for the respective observation, and the same extremes are applied to each panel. Gray contours show the [3, 5, 10,15, 20]σrms levels of the data images obtained with robust 0.5 and shown in Figure 1. The FWHM of the synthesized beams and the 2 au scale bars are indicated in the lower left and right corners of each panel, respectively.
Other Images in This Article
Show More
Copyright and Terms & Conditions
© 2026. The Author(s). Published by the American Astronomical Society.

