

Image Details
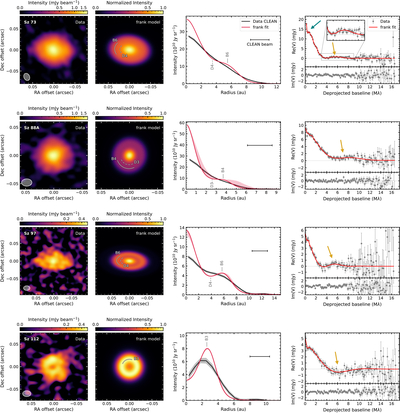
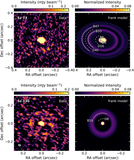
Caption: Figure 2.
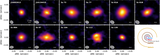
Comparison of data and the frank visibility fit for disks showing substructures within 10 au. First panel: continuum image (robust 0.5) with the synthesized beam shown in the lower left; an asinh stretch is applied to the color scale to visually enhance the fainter emission. Second panel: the frank model swept over 2π and projected, with normalized intensity and asinh stretch; dashed arcs labeled “D” mark gaps and solid arcs labeled “B” mark rings, each followed by the distance from the star in astronomical units. Third panel: deprojected, azimuthally averaged radial intensity profiles of the CLEAN data with robust 0.5 (black) and the frank model (red). Gray shading shows the 1σ CLEAN uncertainty per radial bin divided by the square root of the number of beams in the annulus; red shading shows the 16th–84th percentile range of the Monte Carlo uncertainty propagation of the frank fit (Section 3.2). Rings and gaps are marked as in the second panel; the scale bar indicates the mean FWHM of the synthesized beam. Fourth panel: deprojected visibilities (real and imaginary parts) azimuthally averaged in 150 kλ bins for the data (gray points) and frank model (red line). Arrows indicate robust detections (solid) or hints (dashed) of inner (yellow) and outer (teal) disk substructures.
Other Images in This Article
Show More
Copyright and Terms & Conditions
© 2026. The Author(s). Published by the American Astronomical Society.

