

Image Details
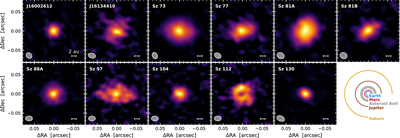
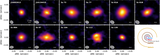
Caption: Figure 1.
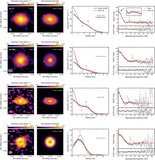
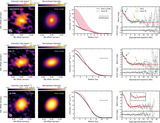
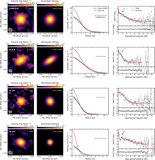
Gallery of continuum images at 0.87 mm (343.5 GHz) of our sample, obtained with a robust 0.5. The source order is alphabetical. All images are shown on the same angular scales. The FWHM of the synthesized beams and the 2 au scale bars are indicated in the lower left and right corners of each panel, respectively. The color scale is linear and ranges from null to peak intensity for each disk. The corresponding color scales for each source are shown in Figures 2–4. For comparison, in the lower right are shown the angular sizes of the orbits of Earth, Mars, the Asteroid Belt, Jupiter, and Saturn, assuming the average distance of the sources in our sample (157.4 pc).
Other Images in This Article
Show More
Copyright and Terms & Conditions
© 2026. The Author(s). Published by the American Astronomical Society.

