

Image Details
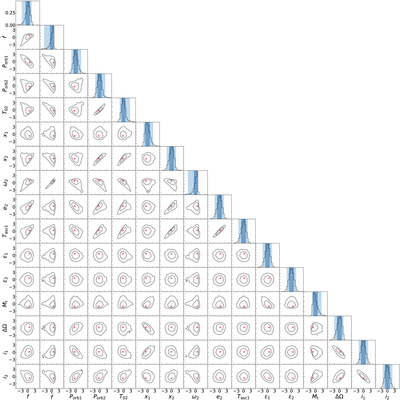
Caption: Figure 7.
The probability distributions (corner plots) of the fitted parameters in the timing solution A in Table 3 (similar for solution B, not shown) using TEMPO2 (G. B. Hobbs et al. 2006). They are calculated using the nested sampling technique based on the ReactiveNestedCalibrator function in ULTRANEST (E. Higson et al. 2019; J. Buchner 2021). All parameters have been scaled by their mean and standard deviation, and all subpanels are plotted over the range ±5σ with two contour lines for the 68% and 95% possibilities. The red cross marks the maximum probability. The dark shadow in the histogram marks the ±1σ range, and the shallow shadow marks the ±2σ range.
Other Images in This Article
Copyright and Terms & Conditions
© 2026. The Author(s). Published by the American Astronomical Society.

