

Image Details
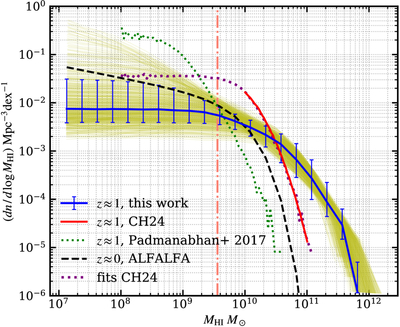
Caption: Figure 3.
z ≈ 1 HIMF corresponding to 1000 randomly selected HIHM parameters from the posterior (olive curves). The blue solid curve shows the median of the sampled HIMF, chosen to be the best fit. The error bars indicate the 68% credible region around the best fit. The orange dotted–dashed line marks the H I mass corresponding to the best-fit lower-mass cutoff Mcut. The red solid curve shows z ≈ 1 HIMF reported by CH24. The z ≈ 1 HIMF corresponding to HIHM parameters estimated by H. Padmanabhan et al. (2017) is shown by the green dotted curve. The black dashed curve shows the z ≈ 0 HIMF obtained using the ALFALFA survey (M. G. Jones et al. 2018).
Other Images in This Article
Copyright and Terms & Conditions
© 2026. The Author(s). Published by the American Astronomical Society.

