

Image Details
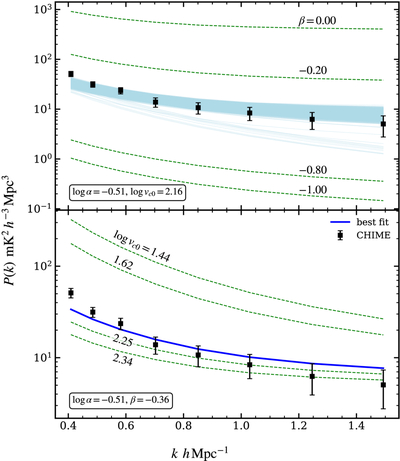
Caption: Figure 1.
The observed 21 cm PS by CHIME Collaboration et al. (2025) is shown by black squares with 1σ error bars. The dashed lines indicate the simulated PS as the HIHM parameters β (top) and vc0 (bottom) are changed, while the other parameters are kept fixed. The light blue curves in the top panel show the predicted 21 cm PS for 1000 randomly selected HIHM parameters from the posterior. The solid blue curve in the bottom panel shows the median of the sampled PS chosen to be the best fit.
Other Images in This Article
Copyright and Terms & Conditions
© 2026. The Author(s). Published by the American Astronomical Society.

Copyright ©
2026 Astronomy Image Explorer. All Rights Reserved.
