

Image Details
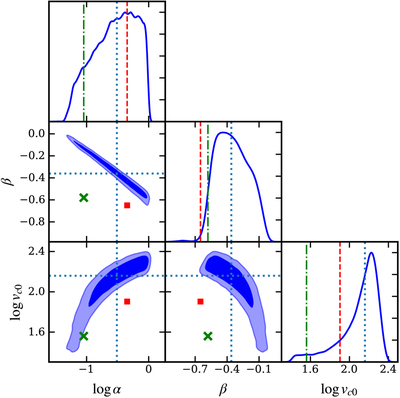
Caption: Figure 2.
Marginalized 1D and 2D posterior distributions of the HIHM parameters, using the z ≈ 1 measurements of ΩH I and the 21 cm PS. The contours show the 68th and 95th percentiles. The blue dotted lines indicate the best-fit values. The red square and dashed lines indicate the HIHM parameters fitted to obtain the HIMF by CH24. The green cross and dotted–dashed lines indicate the HIHM parameters estimated by H. Padmanabhan et al. (2017).
Other Images in This Article
Copyright and Terms & Conditions
© 2026. The Author(s). Published by the American Astronomical Society.

Copyright ©
2026 Astronomy Image Explorer. All Rights Reserved.
