

Image Details
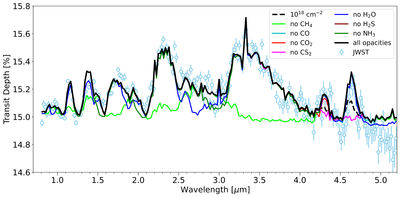
Caption: Figure 4.
Model-predicted transmission spectrum based on the fiducial model (3× Z⊙, Kzz = 108 cm2 s−1, and Tint = 100 K) presented in Figure 1. The black solid line represents the simulated transmission spectrum including all opacity sources, while the black dashed line shows the same model with the CS2 abundance adjusted to yield a column density of 1018 molecules cm−2 within the observable atmosphere, corresponding to the approximate detectability threshold (refer to Section 3.6). Colored solid lines show simulated transmission spectra computed while excluding the opacity contribution from individual molecular species, as indicated. Light blue symbols with error bars denote the JWST observations presented in the companion observational study by M. Zhang et al. (2026).
Other Images in This Article
Copyright and Terms & Conditions
© 2026. The Author(s). Published by the American Astronomical Society.

