

Image Details
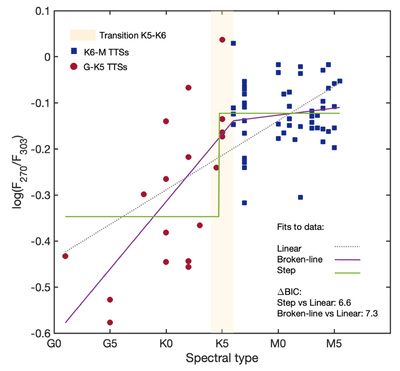
Caption: Figure 4.
Statistical evidence for a transition in UV continuum properties. Dependence of ﹩\mathrm{log}(F270/F303)﹩ on spectral type for the full TTS sample. Late-type stars (K6–M5) are shown as blue squares and warm stars (G0–K5) as red circles. The curves show three statistical descriptions of the data: a single linear relation (gray dotted line), a continuous broken-line transition (purple), and a step-transition model (green). The shaded region marks the approximate spectral-type interval where pre-main-sequence stars develop radiative cores.
Other Images in This Article
Copyright and Terms & Conditions
© 2026. The Author(s). Published by the American Astronomical Society.

Copyright ©
2026 Astronomy Image Explorer. All Rights Reserved.
