

Image Details
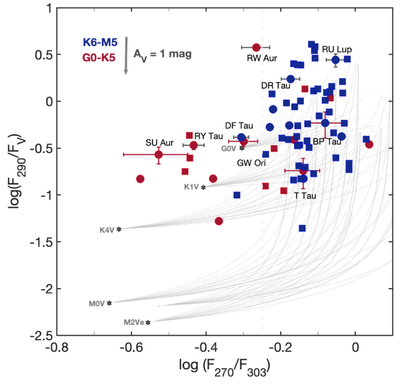
Caption: Figure 2.
UV color map of accreting TTSs. Late-type stars (K6–M5) are shown in blue and warm stars (G0–K5) in red. Circles correspond to IUE observations and squares to HST/ULLYSES data. Gray curves show representative tracks from the photosphere-plus-shock model grid, adding accretion-shock continua to empirical stellar photospheres. Labels identify stars with multiple observations. Black error bars illustrate correlated UV–V variability, while red error bars represent the corresponding 1σ uncorrelated variability. The gray arrow indicates the reddening vector for AV = 1 mag.
Other Images in This Article
Copyright and Terms & Conditions
© 2026. The Author(s). Published by the American Astronomical Society.

Copyright ©
2026 Astronomy Image Explorer. All Rights Reserved.
