

Image Details
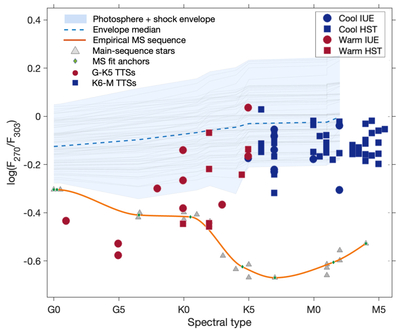
Caption: Figure 3.
Empirical UV photospheric sequence and photosphere-plus-shock model envelope. Warm TTSs (G0–K5; red circles), late-type TTSs (K6–M5; blue squares), and main-sequence stars (gray triangles) are shown in the ﹩\mathrm{log}(F270/F303)﹩–spectral-type plane. The solid blue curve represents the empirical photospheric sequence derived from the main-sequence sample. The shaded region shows the range of UV colors spanned by the adopted ensemble of photosphere-plus-shock models for veiling factors R = 0.01–0.5.
Other Images in This Article
Copyright and Terms & Conditions
© 2026. The Author(s). Published by the American Astronomical Society.

Copyright ©
2026 Astronomy Image Explorer. All Rights Reserved.
