

Image Details
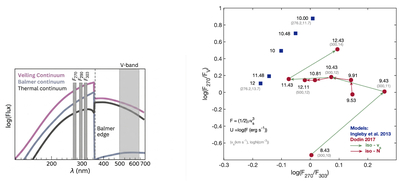
Caption: Figure 1.
UV continuum diagnostics and accretion-shock models. Left: schematic illustration of the continuum components contributing to the UV excess in accreting TTSs. Right: predicted locations of accretion-shock models in the ﹩\mathrm{log}(F270/F303)﹩–﹩\mathrm{log}(F290/{F}_{V})﹩ plane. Blue squares show the models of L. Ingleby et al. (2013), labeled by the accretion energy flux (﹩\mathrm{log}{ \mathcal F }﹩), with representative combinations of infall velocity (vs) and preshock density (N) indicated for selected models. Red circles show the models of A. Dodin (2018). Green arrows denote increasing infall velocity at fixed density, and red arrows denote increasing density at fixed velocity. The diversity of model trajectories illustrates how the UV continuum colors respond to variations in the physical properties of magnetospheric accretion flows, in particular to changes in preshock density and infall velocity.
Other Images in This Article
Copyright and Terms & Conditions
© 2026. The Author(s). Published by the American Astronomical Society.

