

Image Details
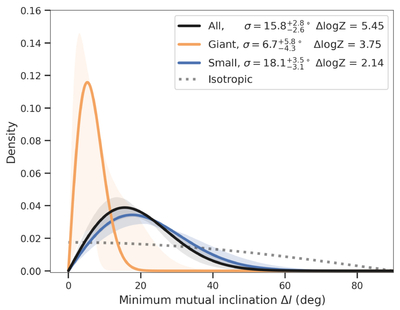
Caption: Figure 2.
Hierarchical Bayesian inference of the ΔI distribution. The black curve shows the inferred distribution for the full sample, while the orange and blue curves correspond to systems hosting giant inner planets (Min > 0.3 MJup or 95 M⊕) and lower-mass inner planets (Min < 0.3 MJup or 95 M⊕), respectively. The gray dotted curve represents the isotropic expectation. The quoted ﹩{\rm{\Delta }}\mathrm{log}Z﹩ values are relative to the isotropic model.
Other Images in This Article
Copyright and Terms & Conditions
© 2026. The Author(s). Published by the American Astronomical Society.

Copyright ©
2026 Astronomy Image Explorer. All Rights Reserved.
