

Image Details
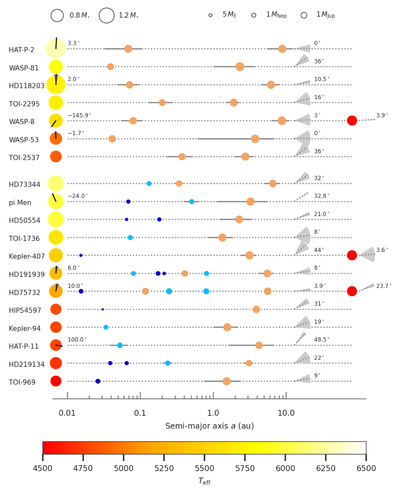
Caption: Figure 1.
Orbital architectures of the 19 systems with well-constrained ΔI derived from the joint RV and astrometric analysis. Each row represents one planetary system. Colored circles denote planets, with the circle size proportional to the planetary (minimum) mass. Dark blue, light blue, and orange symbols correspond to super-Earths (Mp ≲ 10 M⊕), Neptune/Saturn-mass planets (10 ≲ Mp/M⊕ ≲ 95), and Jupiter-mass planets (Mp ≳ 95 M⊕), respectively. The horizontal black bars attached to the symbols illustrate the orbital excursion between periastron and apastron. Red symbols on the right indicate outer distant stellar companions. The stellar symbols on the left show the host stars, with symbol size scaling with stellar mass and color indicating stellar effective temperature. The black region overlaid on several host stars indicates the projected stellar obliquity angle, when available, adopted from X.-Y. Wang et al. (2026). The gray shaded sectors on the right illustrate the minimum mutual inclination, ΔI = ∣90° − Iout∣. The quoted values correspond to the median of the posterior distribution, while the extent of each sector indicates the 68% credible interval derived from the orbital fit.
Other Images in This Article
Copyright and Terms & Conditions
© 2026. The Author(s). Published by the American Astronomical Society.

