

Image Details
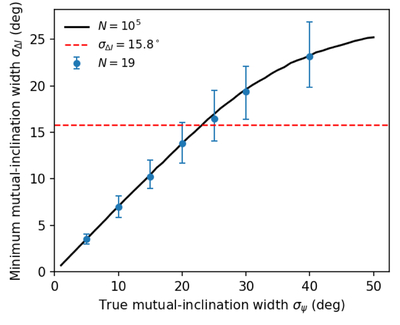
Caption: Figure D1.
Forward Monte Carlo mapping between the Rayleigh width of the true mutual inclination (σψ) and that of the minimum mutual inclination (σΔI). The black curve is obtained from simulations with 105 systems, while the blue points show the median and 68% intervals from repeated realizations with N = 19, corresponding to the sample size of this work. The red dashed line marks the observed value, σΔI = 15﹩\mathop{.}\limits^{{\unicode{x000b0}}}﹩8.
Other Images in This Article
Copyright and Terms & Conditions
© 2026. The Author(s). Published by the American Astronomical Society.

Copyright ©
2026 Astronomy Image Explorer. All Rights Reserved.
