

Image Details
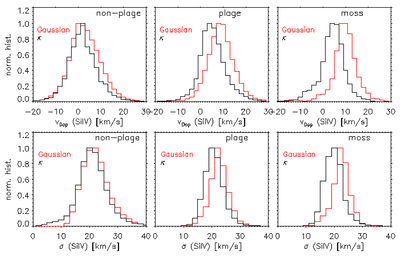
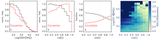
Caption: Figure 5.
Distributions of Gaussian profiles and κ-like profiles as a function of line shift and width, for different solar features: nonplage, plage, and moss. We plot histograms (each normalized to its peak) for Gaussian and κ-like profiles versus line shift (top row) and line width (bottom row) in different solar features: nonplage (left column), plage (center), and moss (right column). The criteria used to select the solar features are described in detail in Section 2. The full-disk data have been used to derive these histograms.
Other Images in This Article
Copyright and Terms & Conditions
© 2026. The Author(s). Published by the American Astronomical Society.

Copyright ©
2026 Astronomy Image Explorer. All Rights Reserved.
