

Image Details
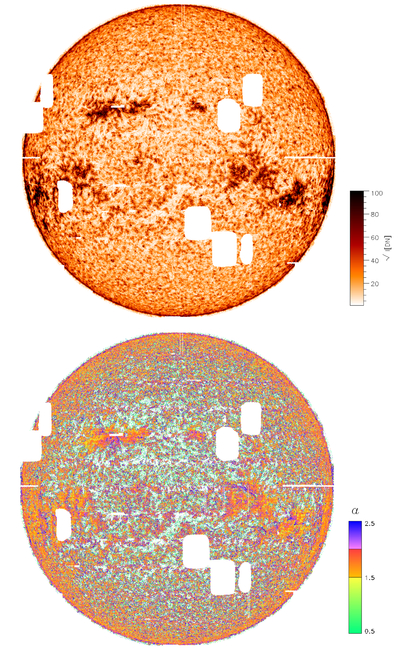
Caption: Figure 1.
Maps of Si IV 1393.76 Å transition region line properties over the full solar disk, from IRIS full-disk mosaics of 2014 March 17. We show maps from pseudo-Gaussian line fitting for the Si IV 1393.76 Å line intensity (top) and the α parameter describing the line shape (with α = 2, <2, and >2 corresponding, respectively, to Gaussian profiles, κ-like profiles, and more rectangular profiles with truncated wings). White areas represent regions masked out from our analysis because they are affected by missing data or excessive particle radiation (see T. Ayres et al. 2021).
Other Images in This Article
Copyright and Terms & Conditions
© 2026. The Author(s). Published by the American Astronomical Society.

Copyright ©
2026 Astronomy Image Explorer. All Rights Reserved.
