

Image Details
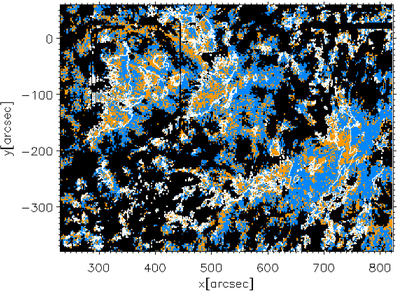
Caption: Figure 3.
Map of the spatial distribution of non-Gaussian/Gaussian transition region line profiles and their relation to the angle between the magnetic field and the line of sight. The colored map shows κ-like (α < 1.85) profiles in blue, and Gaussian (1.85 < α < 2.15) profiles in orange, for pixels with total intensity above 500 DN (to reduce the potential impact of the signal-to-noise ratio on the line profile determination), for the field of view shown in Figure 2. The white contours delineate regions where ﹩\cos (i)﹩ is above 0.7, i.e., where the line of sight is more aligned with the magnetic field direction (the angle i between the two is ≲45∘).
Other Images in This Article
Copyright and Terms & Conditions
© 2026. The Author(s). Published by the American Astronomical Society.

