

Image Details
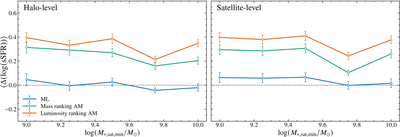
Caption: Figure 3.
Best-fitting constant amplitudes obtained by fitting a horizontal line to each raw conformity curve shown in Figure 2. The left panel shows the halo-level results and the right panel shows the satellite-level results. Blue, green, and orange lines correspond to the ML, mass-ranking AM, and luminosity-ranking AM halo masses, respectively. Error bars indicate the 1σ uncertainties of the fitted constant amplitudes. The fitted amplitudes depend systematically on the adopted halo-mass method.
Other Images in This Article
Copyright and Terms & Conditions
© 2026. The Author(s). Published by the American Astronomical Society.

Copyright ©
2026 Astronomy Image Explorer. All Rights Reserved.
