

Image Details
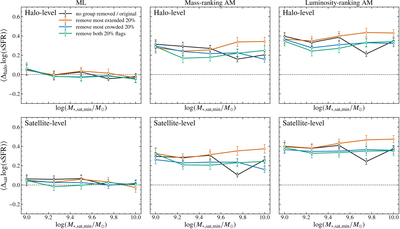
Caption: Figure 4.
Robustness of the one-halo conformity measurements to group configurations that are potentially more susceptible to group-finder systematics. The top and bottom rows show the halo-level and satellite-level measurements, respectively. The left, middle, and right columns use the ML, stellar-mass-ranking abundance-matching, and luminosity-ranking abundance-matching halo-mass estimates. Black points show the original measurements. Orange and blue points show the results after removing the most extended 20% and the most crowded 20% of groups, respectively, while green points show the results after both populations are removed.
Other Images in This Article
Copyright and Terms & Conditions
© 2026. The Author(s). Published by the American Astronomical Society.

