

Image Details
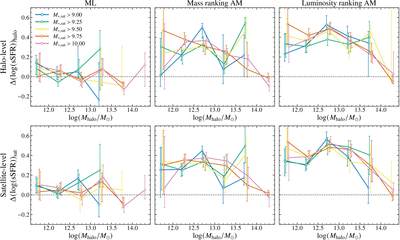
Caption: Figure 2.
Raw one-halo conformity signals measured from the five complete samples. The upper row shows the halo-level statistic, while the lower row shows the satellite-level statistic. From left to right, the three columns use halo masses derived from the ML method, the mass-ranking AM method, and the luminosity-ranking AM method, respectively. Different colors correspond to the five complete samples defined in Figure 1. Error bars show the bootstrap uncertainties, and the dashed horizontal lines mark zero signal.
Other Images in This Article
Copyright and Terms & Conditions
© 2026. The Author(s). Published by the American Astronomical Society.

Copyright ©
2026 Astronomy Image Explorer. All Rights Reserved.
