

Image Details
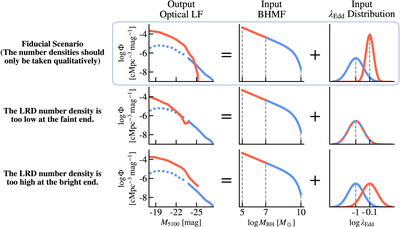
Caption: Figure 4.
A schematic cartoon showing how different combinations of black hole mass functions and Eddington ratio distributions of the LRDs (red) and quasars (blue) affect the shapes of the LFs. The first row is our fiducial model, where LRDs represent a population of low-mass black holes with high Eddington ratio and small scatter in the Eddington ratio distribution. For the quasars, the QLF is extrapolated below an observed limit and marked with the dashed curve. This figure is entirely demonstrative and should mostly be taken qualitatively.
Other Images in This Article
Copyright and Terms & Conditions
© 2026. The Author(s). Published by the American Astronomical Society.

Copyright ©
2026 Astronomy Image Explorer. All Rights Reserved.
