

Image Details
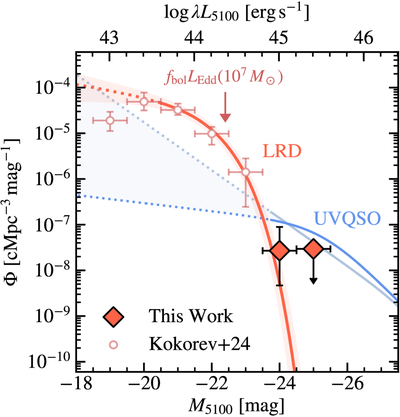
Caption: Figure 3.
Left: the optical LF of LRDs at 4.5 < z < 4.9 is shown in red. The solid diamonds are the measurements done in this work. The upper limit is the 1σ value. The empty circles are measurements from LRD candidates identified by V. Kokorev et al. (2024) at 4.5 < z < 4.9 with JWST. The best-fit Schechter model is shown in the red with the 68% confidence interval shaded (the dotted section is the extrapolation beyond the luminosity range used to conduct the MLE). The light and dark blue curves are the LFs for UVQSOs at 4.7 < z < 5.5 measured by G. Kulkarni et al. (2019) and at z ∼ 5 by M. Niida et al. (2020). The dashed lines are the extrapolated quasar LFs down to the faint ends. The arrow marks the optical luminosity of a 107 M⊙ black hole with Lbol/LEdd = 1, assuming Lbol/λL5100 = 5.4 for the LRDs (J. E. Greene et al. 2026). In contrast, the bolometric correction for the quasars is Lbol/λL5100 = 10.3 (G. T. Richards et al. 2006).
Other Images in This Article
Copyright and Terms & Conditions
© 2026. The Author(s). Published by the American Astronomical Society.

