

Image Details
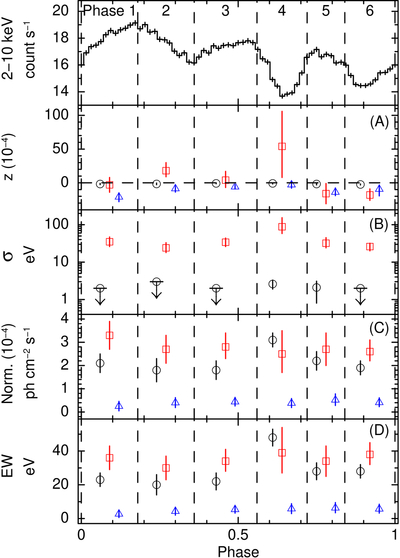
Caption: Figure 6.
Pulse profile (top; same as Figure 2) and variations in the Fe Kα and Kβ line spectral parameters as a function of pulse phase, obtained from the best-fit models in Table 2: (A) redshift z, (B) broadening width σ, (C) normalization (flux), and (D) EW. The black circles, red squares, and blue triangles represent the parameters for the narrow Fe Kα, broad Fe Kα, and narrow Fe Kβ lines, respectively. For clarity, the marker positions of the circles and triangles are slightly shifted along the X-axis. Note that the z-values for the Fe Kβ line are the sum of the two zashift model parameters (i.e., the total redshift from the rest frame).
Other Images in This Article
Copyright and Terms & Conditions
© 2026. The Author(s). Published by the American Astronomical Society.

