

Image Details
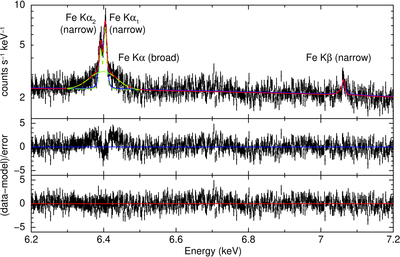
Caption: Figure 4.
(Top) Pulse-phase-averaged Resolve spectrum in the 6.2–7.2 keV range. The blue and red solid lines indicate the best-fit model using Model 1 and Model 2, respectively. The contributions of the narrow and broad Fe Kα components for Model 2 are also shown as green dashed lines. The middle and bottom panels show residuals between the data and the models in the cases of Model 1 and Model 2, respectively. The error bars represent 1σ statistical uncertainty.
Other Images in This Article
Copyright and Terms & Conditions
© 2026. The Author(s). Published by the American Astronomical Society.

Copyright ©
2026 Astronomy Image Explorer. All Rights Reserved.
