

Image Details
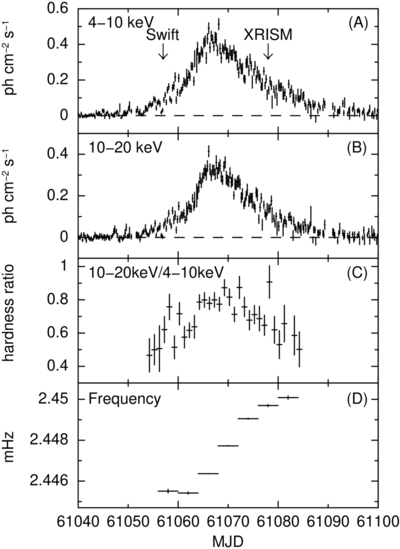
Caption: Figure 1.
MAXI/GSC light curves of 1A 1118−61 during the 2026 outburst in the (A) 4–10 keV and (B) 10–20 keV with a 6 hr time bin, and (C) the 10–20 to 4–10 keV hardness ratio with a 1 day time bin. The epochs of the first Swift/BAT detection (MJD 61057; R. Gupta et al. 2026a, 2026b) and the XRISM observation (MJD 61078) are indicated with arrows. (D) The pulse-frequency change monitored by Fermi/GBM. All error bars represent the 1σ statistical uncertainties.
Other Images in This Article
Copyright and Terms & Conditions
© 2026. The Author(s). Published by the American Astronomical Society.

Copyright ©
2026 Astronomy Image Explorer. All Rights Reserved.
