

Image Details
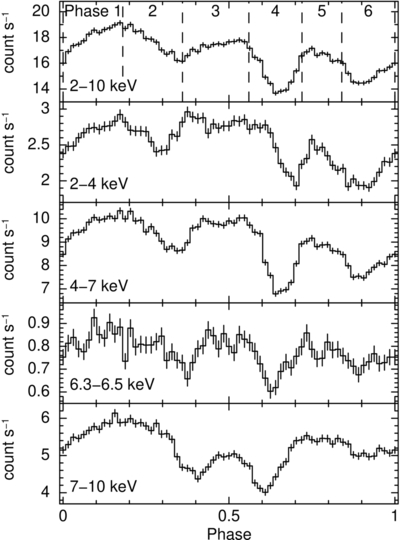
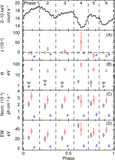
Caption: Figure 2.
Pulse profiles in the 2–10, 2–4, 4–7, 6.3–6.5, and 7–10 keV bands (from top to bottom) with error bars representing the 1σ statistical uncertainty. In the top panel, vertical dashed lines represent the boundaries of pulse phases adopted in the pulse-phase-resolved spectral analysis (Section 3.3), located at 0.0 (1.0), 0.18, 0.36, 0.56, 0.72, and 0.84.
Other Images in This Article
Copyright and Terms & Conditions
© 2026. The Author(s). Published by the American Astronomical Society.

Copyright ©
2026 Astronomy Image Explorer. All Rights Reserved.
