

Image Details
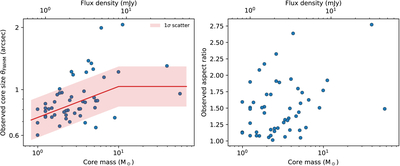
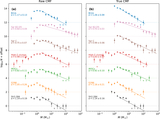
Caption: Figure C1.
Observed core sizes and aspect ratios as a function of core mass. The left panel shows the observed core size, defined as the geometric mean FWHM, ﹩{\theta }_{{\rm{FWHM}}}={({\theta }_{{\rm{maj}}}{\theta }_{{\rm{\min }}})}^{1/2}﹩, without deconvolving the ALMA synthesized beam. The red curve shows the empirical size model adopted for the core insertion experiments, obtained from a robust linear regression: ﹩{\mathrm{log}}_{10}({\theta }_{\mathrm{FWHM}}\,{\mathrm{arcsec}}^{-1})=-0.135+0.150\,{\mathrm{log}}_{10}(M/{M}_{\odot })﹩. The shaded region shows the 1σ scatter, estimated as the standard deviation of the residuals in ﹩{\mathrm{log}}_{10}{\theta }_{{\rm{FWHM}}}﹩ around this relation. The trend is held fixed above 10 M⊙ since only a few cores are available. The right panel shows the observed aspect ratio, ﹩{\theta }_{{\rm{maj}}}/{\theta }_{{\rm{\min }}}﹩. The upper axis gives the corresponding 1.3 mm flux density.
Other Images in This Article
Copyright and Terms & Conditions
© 2026. The Author(s). Published by the American Astronomical Society.

