

Image Details
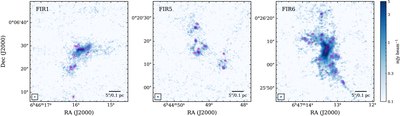
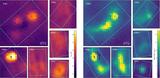
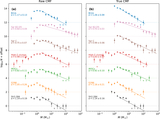
Caption: Figure 3.
Zoom-in views of the ALMA 1.3 mm continuum emission toward the clustered regions in FIR1, FIR5, and FIR6. The blue color scale and blue contours show the continuum emission, with contour levels the same as in Figure 2. Red crosses mark the cores identified in the full dendrogram catalog, while magenta ellipses show the Gaussian components for cores retained in the robust dendrogram+Gaussian catalog. The synthesized beam and scale bar are shown in the bottom-left and bottom-right corners of each panel, respectively.
Other Images in This Article
Copyright and Terms & Conditions
© 2026. The Author(s). Published by the American Astronomical Society.

Copyright ©
2026 Astronomy Image Explorer. All Rights Reserved.
