

Image Details
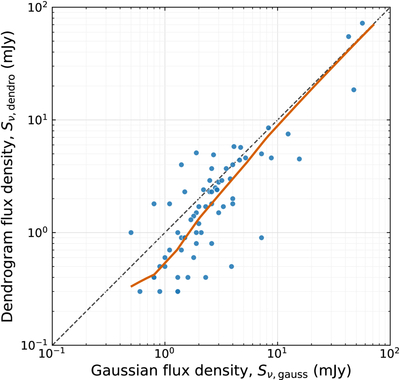
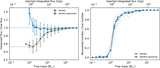
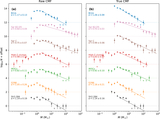
Caption: Figure C3.
Comparison between the dendrogram-integrated and Gaussian-fit fluxes for the observed cores. The dashed line marks the one-to-one relation. Colored curves show the expected relation Sν,dendro = ffluxSν,gauss by treating the Gaussian-fit flux as the reference source flux and applying the corresponding flux recovery function derived from the artificial core experiments.
Other Images in This Article
Copyright and Terms & Conditions
© 2026. The Author(s). Published by the American Astronomical Society.

Copyright ©
2026 Astronomy Image Explorer. All Rights Reserved.
