

Image Details
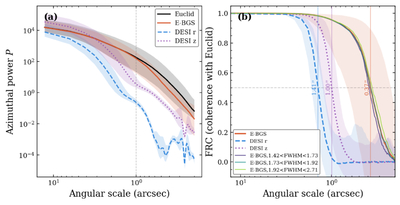
Caption: Figure 4.
Fourier-domain comparison with the held-out Euclid VIS observations over the test set (median; shaded 16th–84th-percentile intervals). (a) Azimuthally averaged power spectrum P versus angular scale for Euclid VIS, E-BGS, and the DESI r and z bands. (b) FRC with the held-out Euclid VIS observations for E-BGS and the DESI bands. The horizontal dashed line marks FRC = 0.5, and the vertical dashed lines mark the corresponding crossing scale q0.5 for each curve. Thin curves show the E-BGS FRC in three bins of DESI r-band PSF FWHM.
Other Images in This Article
Copyright and Terms & Conditions
© 2026. The Author(s). Published by the American Astronomical Society.

Copyright ©
2026 Astronomy Image Explorer. All Rights Reserved.
