

Image Details
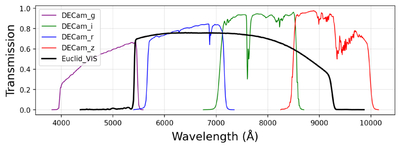
Caption: Figure 1.
Transmission curves for the DECam g, r, i, and z bands and the Euclid VIS channel (∼550–900 nm). The DECam curves illustrate the wavelength coverage in the southern footprint; BASS/MzLS use their corresponding northern grz filters.
Other Images in This Article
Copyright and Terms & Conditions
© 2026. The Author(s). Published by the American Astronomical Society.

Copyright ©
2026 Astronomy Image Explorer. All Rights Reserved.
