

Image Details
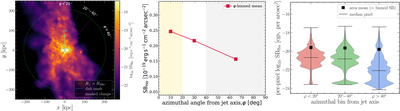
Caption: Figure A1.
Intrinsic Hα surface-brightness diagnostics of a jet-mode galaxy (g54 in m25n512) from the SIMBA simulation, viewed edge-on to the jet. Left: Hα surface-brightness map over a ±250 kpc field. The cyan arrow marks the projected jet axis, the green dotted circle marks the R⊥ = R200c aperture, the blue rectangle marks the masked edge-on disk, and the red circles mark masked compact star-forming clumps. The blue and magenta radial lines show the three azimuthal bins measured from the jet axis: φ < 20∘, 20∘ < φ < 40∘, and φ > 40∘. Middle: stacked Hα surface brightness as a function of azimuthal angle φ. Red squares show the mean surface brightness in the three coarse azimuthal bins, matching the angular bins used for the observed Hα stacks. Right: per-pixel ﹩{\mathrm{log}}_{10}﹩ Hα surface-brightness distributions in the same three azimuthal bins. Black squares show the area-averaged surface brightness, and horizontal black lines show the median pixel value. The means lie above the medians, indicating that the azimuthally binned signal is dominated by a relatively small number of bright pixels.
Other Images in This Article
Copyright and Terms & Conditions
© 2026. The Author(s). Published by the American Astronomical Society.

