

Image Details
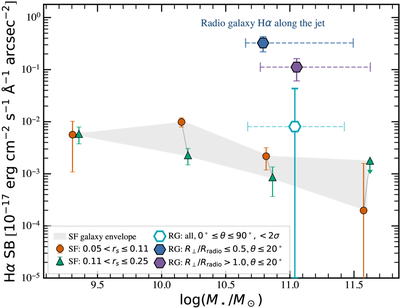
Caption: Figure 3.
Hα emission surface brightness as a function of stellar mass. All measurements are expressed as rest-frame surface brightnesses after correcting for cosmological dimming by a factor of (1 + z)4. The orange circles and green triangles show star-forming galaxy measurements from H. Zhang et al. (2020) in two bins of scaled projected radius, rs = rp/R180, where rp is the projected distance from the galaxy center and R180 is the virial radius. The gray shaded region marks the corresponding range of Hα surface brightnesses observed from the inner to outer regions of these star-forming galaxies and groups (H. Zhang et al. 2016, 2020). The cyan hexagon shows the radio-galaxy stack including all background-quasar sight lines, independent of angular position relative to the radio axis (0∘ ≤ θ ≤ 90∘). Since the Hα flux stacked over all azimuthal angles is a nondetection (<2σ; see Figure 2(b)), this point should be interpreted as an upper limit. This upper limit is consistent with the Hα surface brightness expected for normal-galaxy halos (H. Zhang et al. 2016; Y.-L. Chang et al. 2024). The blue and purple hexagons show radio-galaxy stacks restricted to sight lines within 20∘ of the projected radio axis. They are separated into inner sight lines with R⊥/Rradio ≤ 0.5 and outer sight lines with R⊥/Rradio > 1.0, which are close to the radio lobes. The Hα emission from jet-aligned sight lines is much stronger and is enhanced by nearly 1–2 orders of magnitude relative to the normal-galaxy baseline at similar stellar mass. This indicates that the Hα emissivity from cool ionized CGM is preferentially brightened along directions where radio jets interact with halo gas.
Other Images in This Article
Copyright and Terms & Conditions
© 2026. The Author(s). Published by the American Astronomical Society.

