

Image Details
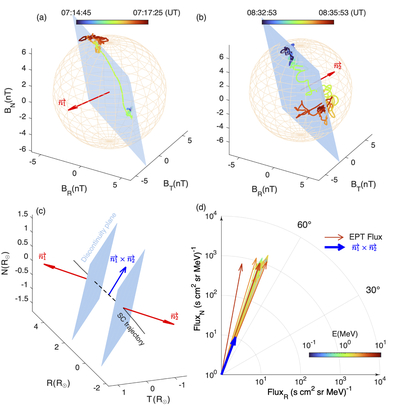
Caption: Figure 4.
Discontinuity analysis across the SFD boundaries on 2023 December 15. (a)–(b) Magnetic hodograms across the leading (07:16:05 UT) and trailing (08:34:23 UT) boundaries, where the color bar denotes the progression of time. The blue plane and red arrow indicate the discontinuity plane and its normal vector obtained from the SVD method. The orange sphere (radius = ∣B∣) represents the averaged field magnitude during the transition. (c) Orientation of the discontinuity planes relative to the SolO trajectory (black lines) during the SFD crossing. The blue arrow indicates the direction of the magnetic flux tube axis. (d) Directions and magnitudes of SEP fluxes from 100 keV to 10 MeV relative to the flux tube axis in the R–N plane.
Other Images in This Article

Copyright and Terms & Conditions
© 2026. The Author(s). Published by the American Astronomical Society.

