

Image Details
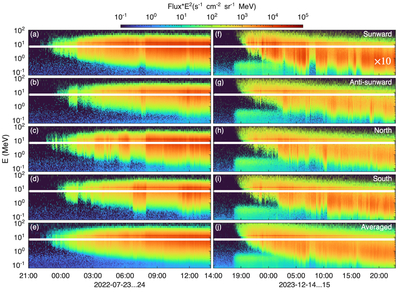
Caption: Figure 1.
Energy spectrograms observed by SolO/EPD for two intervals: (a)–(e) 2022 July 23 21:00 UT to July 24 14:00 UT, and (f)–(j) from 2023 December 14 16:00 UT to December 15 23:00 UT. In both cases, the top four panels show observations from the HET and EPT in four viewing directions (sunward, antisunward, north, and south), and the bottom panel shows the flux averaged over all viewing directions at each time step. Intensities in panels (f)–(j) have been scaled by a factor of 10 to enhance the visibility.
Other Images in This Article
Copyright and Terms & Conditions
© 2026. The Author(s). Published by the American Astronomical Society.

Copyright ©
2026 Astronomy Image Explorer. All Rights Reserved.
