

Image Details
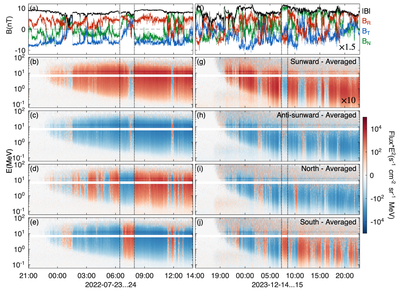
Caption: Figure 2.
Magnetic field components in RTN coordinates and energy spectrograms in four looking directions (with the averaged value subtracted) of two SEP events in Figure 1. The vertical dotted lines outline the selected SFDs intervals in each event. The magnetic field strength and spectrogram intensity in the right panels are scaled by factors of 1.5 and 10, respectively.
Other Images in This Article

Copyright and Terms & Conditions
© 2026. The Author(s). Published by the American Astronomical Society.

Copyright ©
2026 Astronomy Image Explorer. All Rights Reserved.
