

Image Details
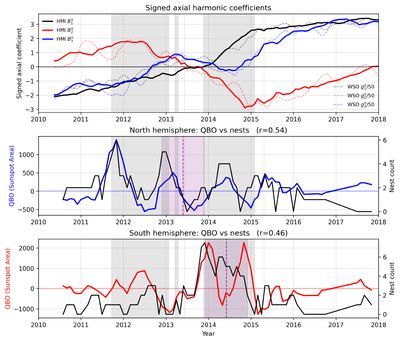
Caption: Figure 4. Signed Axial Harmonic Coefficients and Hemispheric QBO–Nest Comparison
The complete figure set (2 images) is available in the online journal.
Top panel: temporal evolution of the signed axial harmonic coefficients during Solar Cycle 24. Solid curves show the HMI coefficients ﹩{B}_{1}^{0}﹩ (black), ﹩{B}_{2}^{0}﹩ (red), and ﹩{B}_{3}^{0}﹩ (blue), corresponding to the axial dipole, quadrupole, and octupole components, respectively, computed using orthonormal spherical harmonics following the convention of M. L. DeRosa et al. (2012). Dashed curves show the corresponding WSO coefficients ﹩{g}_{1}^{0}﹩, ﹩{g}_{2}^{0}﹩, and ﹩{g}_{3}^{0}﹩, which use the Schmidt seminormalization convention (M. L. DeRosa et al. 2012) and are rescaled (divided by 50) for visual comparison only; the WSO curves are shown as a qualitative, independent cross-check of the temporal behavior and are not used in any quantitative comparison. Gray shading indicates intervals during which the magnitude of the HMI axial quadrupole coefficient exceeds that of the HMI axial dipole coefficient, ﹩| {B}_{2}^{0}| \geqslant | {B}_{1}^{0}| ﹩, using the internally consistent HMI coefficients only. Purple shading and dashed lines indicate the approximate intervals and midpoints of the northern and southern polar-field reversals (M. I. Pishkalo 2019). Middle and bottom panels: Hemispheric QBO residuals derived from hemispheric sunspot area are shown for the north (blue; middle panel) and south (red; bottom panel) hemispheres together with the corresponding activity-nest counts (black). The northern and southern hemispheres exhibit temporally offset bursts of QBO activity and nesting. Intervals of enhanced nesting activity broadly overlap intervals in which the axial quadrupole coefficient becomes comparable to or exceeds the axial dipole coefficient. The corresponding figures for Solar Cycles 22 and 23 are available.
Other Images in This Article
Copyright and Terms & Conditions
© 2026. The Author(s). Published by the American Astronomical Society.

